 Sarah Prag shares some reflections on developing the business case for the Local Waste Service Standards Project.
Why a business case?
The central team involved with the Local Waste Service Standards Project knew that we’d need to be able to demonstrate the financial benefits of standards as part of our work (partly in order to justify the funding of the project in the first place!). However this also emerged during the Discovery phase as a high priority for participants. They were going to have to convince colleagues, clients and suppliers to invest time and money in moving to data standards and felt that a business case of some kind would be a useful tool in those conversations. No one had fixed ideas about what form this should take, which gave us the opportunity to experiment.
One step at a time
We decided to take an iterative approach, working through an alpha and beta in parallel with the tech work. This enabled us to develop a potential model and share it early to get feedback before investing too much time going down one track. It was also a great way to stimulate offers of new data as showing something and asking people to feedback on it is more effective than just asking them for data in the abstract.
Digging for data
That said, one of the main challenges at every stage was getting hold of enough real service data to build the case.
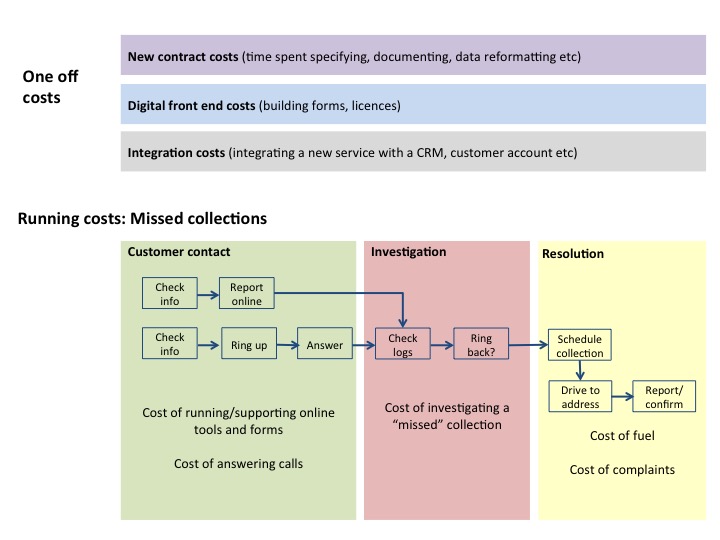
We tried to make the initial ask for data as intuitive and engaging as possible. Off the back of what we’d heard during Discovery I developed a simple colour coded map showing the main areas of activity involved in waste service delivery (or at least the parts where we thought data standards could play a role). In each area I asked a series of questions in plain English and in what I hoped was a logical order with the aim of teasing out things like volumes of calls, time spent investigating, cost of implementing a new form on the website etc. This was sent out to all of the councils participating in the project.
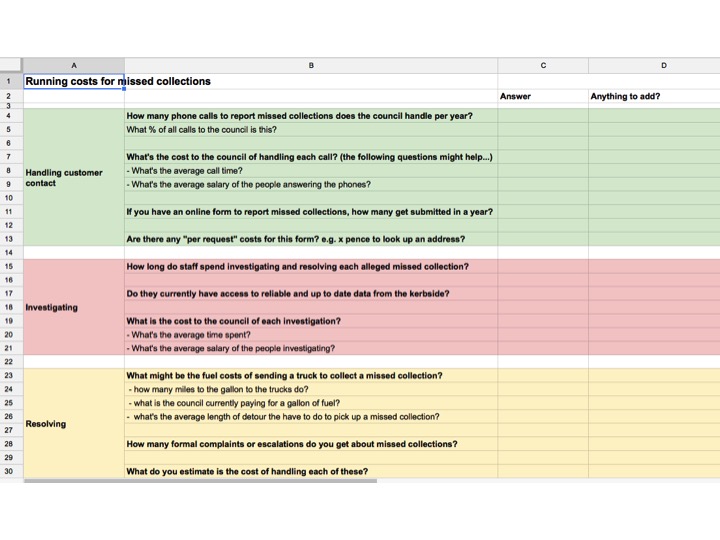 |
In retrospect I think perhaps there were too many questions, making it look like a big task to complete for busy people. Also I was asking them to extract data from other sources and put it in my template adding to the effort needed. If I did something similar again I’d focus on asking for any existing data or reports that people think might be relevant, and then go through these looking for patterns and insights that might be useful. However, I still think placing that request in the context of an end to end service was important and the colour coding was a helpful reference point the whole way through the project.
Piecing together the picture
Asking councils for data to populate an end-to-end view of a service also brought home that different teams are responsible for different elements of delivery, so my request had to be passed from the digital team to customer services to waste services etc. It was interesting that none of the councils already had an end-to-end overview of what it cost to run the service (or at least not one expressed in data that they could easily share).
The end-to-end view I developed was therefore a patchwork of data from different councils and some national studies and reports. Luckily there was always more than one source for each step, which gave me increased confidence in the picture I was building. I also wanted to build a model that could be easily adjusted – either by me as more data came to light, or by people in other organisations who wanted to plug in their own data. For example the model is based on the average number of households served by an English local authority (68,000) but this can be changed at the top of the sheet and all of the calculations adjust accordingly.
Because the I wanted the model to scale up and down in this way I also developed contacts-per-household ratios to make sure the volume of customer contact suggested would always be appropriate regardless of the size of council. When I analysed the data a pretty consistent ratio of 0.05 missed bin calls per household per year emerged so that’s what I used. I think per-household ratios like this could be useful for other projects that want to benchmark across local government.
Bottom up or top down
In keeping with the overall approach of the project the business case started as a bottom-up exercise, based on granular data from individual participating councils. Once we had the core of this we looked out at wider reports and studies – some of which were already published and others that were shared with us. These were really helpful both in terms of backing up some of the numbers I was seeing and also in providing some wider context for our findings – for example the 2015 CIPFA and Red Quadrant Customer Contact Benchmarking Club showed that senior officials had made the link between systems integration and effective channel shift. Independent reports also provided national data for areas where we’d not been able to get bottom-up data – this was particularly true of the BSI Economic Contribution of Standards to the UK Economy report which helped us to make the case for the private sector.
Not just about numbers
In the end the business case document, and the approach we took to developing it, was about more than just numbers. It became a major part of the story we wanted to tell about data standards and what they can achieve. I think was needed because this is still a new area for many in local government, and also one that requires a bit of translation from tech speak into something we can all understand. Hopefully the final business case achieves this, and will be a useful tool beyond the end of our project.